
Key Takeaways
- South Sudan ranks as the world’s poorest country with a GDP per capita of just $313, where 80% live below the poverty line and devastating civil wars have destroyed economic infrastructure.
- Yemen and Afghanistan follow closely behind, both devastated by prolonged conflicts that have collapsed their economies and created massive humanitarian crises affecting millions.
- Sub-Saharan Africa dominates the list of poorest nations, with countries like Burundi, Central African Republic, Madagascar, and Malawi trapped in cycles of poverty due to conflict, climate disasters, and weak governance.
- A global humanitarian funding crisis has emerged in 2026, with a $25 billion gap leaving aid organizations unable to respond to critical needs as 808 million people worldwide live in extreme poverty.
- These nations share common challenges including armed conflict, climate vulnerability, resource curses, political instability, and geographic disadvantages that create persistent poverty traps spanning generations.
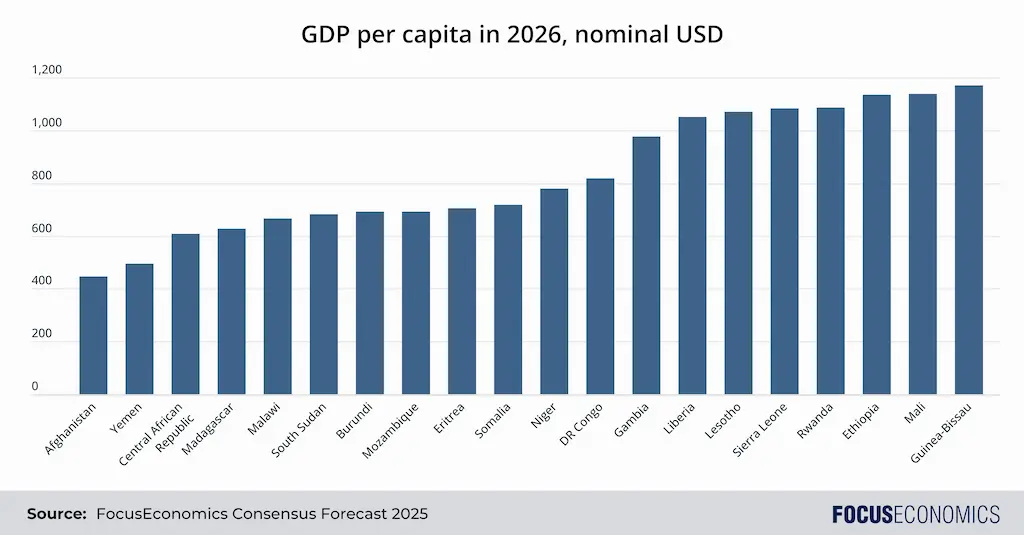
Sub-Saharan Africa continues to dominate the list of poorest countries: When looking at our Consensus Forecasts for the economies with the lowest GDP per capita (in U.S. dollars, current market prices) in 2026, one thing jumps out: 18 of the 20 poorest are from Sub-Saharan Africa (SSA). The non-African nations in the top 20 are the conflict-riven countries Afghanistan and Yemen. Though SSA has been the second-fastest growing economic region after Asia in recent years, exceedingly high population growth—over 2% per annum—means that GDP per capita has risen far more slowly. Moreover, factors such as extreme weather, political turmoil—the continent has experienced a host of coups since 2020—and insecurity continue to stop SSA from reaching its full potential.
Which are the Poorest Countries in the World?
Below is a list of the top 20 poorest countries in the world:
1st poorest country: Afghanistan
GDP per capita 2026 Consensus Forecast: USD 445
Afghanistan’s poverty stems from decades of conflict, including foreign invasions, civil wars, and insurgencies. Continuous instability has ravaged infrastructure, undermined institutional development, and deterred foreign investment. The productivity of the agricultural sector, on which most Afghans rely, is low due to outdated farming practices, water scarcity, and land degradation. Widespread corruption and a weak central government further hamper development, with the economy remaining heavily dependent on international aid. Additionally, the Taliban’s return to power in 2021 has led to the isolation of Afghanistan from global markets and financial systems, stifling the economy and exacerbating humanitarian crises. Our panelists expect only muted GDP growth next year, notwithstanding some support from infrastructure projects linking Afghanistan to Central Asian neighbors.
2nd poorest country: Yemen
GDP per capita 2026 Consensus Forecast: USD 493
Yemen has been beset by civil conflict for over a decade, with the country divided into different factions, chiefly the Houthi-rebel-dominated northwest and the Arab-backed Southern Transition Council in the south. The conflict has ravaged infrastructure and caused mass population displacement; as a result, GDP per capita next year is projected to be only around a third of its pre-crisis level.
3rd poorest country: Central African Republic
GDP per capita 2026 Consensus Forecast: USD 609
The Central African Republic (CAR) is plagued by instability and conflict. Armed groups control large swathes of the country, undermining central government authority and creating a constant state of insecurity. Frequent clashes involving these groups have displaced millions, destroyed infrastructure, and prevented economic development. Though the CAR is abundant in natural resources like diamonds, gold and timber, these assets are often exploited by corrupt officials or rebel groups, with little benefit to the general population. The lack of basic services like education, healthcare and reliable infrastructure further entrenches poverty.
4th poorest country: Madagascar
GDP per capita 2026 Consensus Forecast: USD 628
Madagascar’s low GDP per capita is tied to multiple factors. Firstly, chronic political crises, including coups and contested elections, have weakened institutions and handicapped development efforts. Secondly, deforestation and unsustainable farming practices have degraded the country’s biodiversity, reducing agricultural productivity and increasing vulnerability to natural disasters like cyclones. Thirdly, Madagascar’s geographical isolation from major markets, combined with poor infrastructure, makes trade and investment difficult. Finally, a reliance on low-productivity agriculture and the limited diversification of industries have kept the economy stagnant: Just four goods—cloves, cobalt, nickel and vanilla—account for close to half of all goods exports. The upshot is that nearly 80% of the population lived in extreme poverty (that is, had income of less than USD 2.15 per day) in 2023—the highest rate in the world.
5th poorest country: Malawi
GDP per capita 2026 Consensus Forecast: USD 667
Malawi’s poverty is driven by its dependence on subsistence agriculture, with this activity involving the majority of the population. Extreme climate events—including frequent droughts and floods—regularly disrupt crop yields, exacerbating food insecurity. The most recent of these was the El Niño weather phenomenon, which caused exceedingly dry weather in 2024. Limited industrialization, creaking infrastructure, and an education system that struggles to equip the workforce with marketable skills further stifle economic growth. Additionally, Malawi’s landlocked geography makes trade expensive and hinders access to global markets. Government inefficiencies, corruption, and high population growth further compound these issues. Substantial financial support from foreign creditors provides the economy with a lifeline but has also led to external debt accumulation; Malawi has been in debt default since 2022.
6th poorest country: South Sudan
GDP per capita 2026 Consensus Forecast: USD 683
South Sudan’s poverty is tied to its protracted civil war, which erupted soon after the country gained independence in 2011. The violence displaced millions, destroyed infrastructure and disrupted agriculture, the backbone of the economy. In addition, mismanagement, corruption, and conflict over oil fields have led to inconsistent production and income of petroleum, South Sudan’s main revenue source. Ethnic divisions and fragile political institutions, high inflation, food insecurity, and a lack of education and healthcare further contribute to the country’s underdevelopment. A civil war in neighboring Sudan caused further havoc, with South Sudanese oil exports being shut in due to a pipeline being ruptured in Sudan in early 2024. Our Consensus is for the country’s GDP growth to roughly track the SSA average in the coming years, which will be insufficient to lift the country notably up the GDP per capita rankings.
7th poorest country: Burundi
GDP per capita 2026 Consensus Forecast: USD 692
Burundi’s poverty is a result of its history of ethnic conflict, most notably the 1993–2005 civil war, which shattered its economy and infrastructure. The country relies on subsistence agriculture, but the sector suffers from overpopulation, soil degradation, and limited access to modern farming techniques. Furthermore, political instability and corruption have deterred foreign investment and aid. Burundi also faces a poorly developed education and healthcare system, with the latter failing to prevent the spread of epidemics such as 2024’s mpox outbreak. Finally, frequent flooding has held back activity; in the year to September 2024, torrential rains affected 300,000 people and displaced close to 50,000.
8th poorest country: Mozambique
GDP per capita 2026 Consensus Forecast: USD 692
Mozambique’s underdevelopment stems from a history of colonial exploitation, followed by a drawn-out civil war that ended in 1992. Although the country has abundant natural resources—particularly large gas reserves—their mismanagement, combined with corruption, has limited their contribution to overall development. Infrastructure, particularly in rural areas, remains basic, hampering trade. Periodic natural disasters like cyclones and floods, coupled with an ongoing Islamic State insurgency in the north, have further disrupted economic progress. Mozambique is expected to see above-average growth among SSA economies in the coming years thanks to the extractive sector, though a large share of these economic gains are unlikely to filter through to the ordinary populace.
9th poorest country: Eritrea
GDP per capita 2026 Consensus Forecast: USD 704
Eritrea’s low GDP per capita level stems from the country’s reliance on subsistence agriculture and its status as one of the world’s most closed and repressive nations, which hampers investment and exports. The country does sell some zinc and gold—key sources of foreign exchange. A key threat to political stability is the potential sudden passing of the elderly leader of nearly three decades. Such an event could trigger a fierce succession battle and lead to a level of instability the country has not previously experienced. Tensions with neighboring Ethiopia spilling into conflict are a further risk.
10th poorest country: Somalia
GDP per capita 2026 Consensus Forecast: USD 717
Somalia’s extreme poverty is primarily a result of decades of civil war, the collapse of central government authority, and an ongoing insurgency by the Al-Shabaab militant group. The prolonged absence of a functional government has left infrastructure, including schools, hospitals and roads in a state of disrepair, and piracy and terrorism have scared off potential investors. Clan-based power struggles and fragmented political control make it difficult to implement national development policies. Moreover, the country also suffers from frequent droughts, which devastate agriculture and lead to chronic food insecurity. On the flipside, flooding can also occur, as observed in 2023–2024 due to the El Niño weather pattern; the late-2023 rainy season led to torrential downpours affecting 2.5 million people. More positively, the country benefits from international aid, plus an African Union peacekeeping mission.
11th poorest country: Niger
GDP per capita 2026 Consensus Forecast: USD 780
Niger’s poverty is partly driven by its harsh desert climate, which limits agricultural productivity and contributes to frequent droughts. Moreover, as a landlocked country, it faces challenges in accessing international markets, exacerbating its reliance on low-income farming. The fertility rate—one of the highest in the world—puts immense pressure on the country’s limited resources, particularly in terms of food and basic services. Additionally, Niger’s weak governance, high corruption levels, and ongoing security threats from extremist groups in the Sahel region further undermine development efforts. 2023’s successful coup exacerbated matters by reducing international aid and leading to sanctions by ECOWAS, a regional trading bloc—though the latter have since been lifted.
12th poorest country: DR Congo
GDP per capita 2026 Consensus Forecast: USD 819
The Democratic Republic of the Congo (DRC) is incredibly resource-rich—the country is the main producer of cobalt for instance, a key element in lithium-ion batteries. However, the DRC remains deeply impoverished. Civil wars and conflict, fueled by competition over minerals, have devastated infrastructure and led to millions of deaths and displaced citizens over the years. Fighting with the M23 militia—allegedly backed by Rwanda—continues in the east of the country. Widespread corruption, especially in the mining sector, prevents wealth from reaching the population; the government is ineffectual and unable to provide basic services such as healthcare, education or security. In the coming years, our panelists project that GDP growth should be rapid by regional standards, boosted by foreign investment in mining and transport infrastructure, though economic hardship will persist for many.
13th poorest country: The Gambia
GDP per capita 2026 Consensus Forecast: USD 977
The Gambia’s economy is undiversified and relies on tourism and nut exports. Moreover, the authoritarian rule of Yahya Jammeh (1994–2017) left a legacy of corruption and weak institutions that continue to hinder development. Additionally, high youth unemployment and limited access to quality education contribute further to widespread poverty, with many Gambians resorting to irregular emigration in search of better opportunities. More positively, the country appears relatively politically stable under the current leadership of Adama Barrow, which should aid investment going forward. The construction and tourism sectors, in particular, should push up GDP growth above the SSA average in the coming years.
14th poorest country: Liberia
GDP per capita 2026 Consensus Forecast: USD 1050
Liberia’s poverty is rooted in the aftermath of two devastating civil wars (1989–1997 and 1999–2003), which destroyed much of its infrastructure and left its institutions weak. Although the country is rich in natural resources such as iron ore, gold and rubber, corruption and mismanagement have prevented these industries from benefiting the broader population. The Ebola outbreak in 2014 further crippled the already shaky healthcare system and set back economic recovery efforts. Additionally, Liberia’s education system is underdeveloped, limiting opportunities for workforce development. That said, our Consensus is for the economy to grow faster than the SSA average over the coming years, supported by IMF funding and the development of the mining sector.
15th poorest country: Lesotho
GDP per capita 2026 Consensus Forecast: USD 1072
Lesotho has numerous economic difficulties. The country’s landlocked, mountainous location near the bottom of the African continent hinders trade. Moreover, reliance on South Africa—a far larger country which completely envelopes Lesotho—is a hindrance given how poorly South Africa’s economy has performed in recent years. The country relies on a few narrow industries, chiefly diamonds and textiles, both of which are at risk from U.S. tariffs and fluctuations in external demand. Widespread corruption and violence are further problems. As a result, economic growth is forecast to be around half the SSA average going forward.
16th poorest country: Sierra Leone
GDP per capita 2026 Consensus Forecast: USD 1085
Sierra Leone’s underdevelopment is rooted in the aftermath of its brutal 1991–2002 civil war, which decimated infrastructure and strangled economic activity. Although rich in diamonds, resource mismanagement and corruption have prevented the economic returns from mining reaching the broader population. The country also suffers from poor governance and a fragile healthcare system, which was further strained by the 2014–2016 Ebola outbreak. Agriculture, the primary livelihood for many, remains unproductive due to outdated techniques and low investment.
17th poorest country: Rwanda
GDP per capita 2026 Consensus Forecast: USD 1085
Rwanda has seen a remarkable recovery since the 1994 genocide, with GDP per capita tripling so far this century. The country’s stable political environment, lack of corruption, and strong state-led development plan have all aided growth. However, poverty persists—particularly in rural areas. While the government has made strides in rebuilding infrastructure and diversifying economic growth, agriculture still accounts for around a quarter of GDP and a majority of employment. Moreover, limited natural resources and political instability in the neighboring DRC further constrain development. In addition, in 2025, the economy has taken a blow from EU sanctions on gold exports due to Rwanda’s involvement in conflict in the eastern DRC. But overall, Rwanda is expected to remain one of Africa’s top-performing economies in the coming years due to sustained expansions in the agriculture, industry and services sectors.
18th poorest country: Ethiopia
GDP per capita 2026 Consensus Forecast: USD 1136
Ethiopia’s relative poverty stems from a longstanding mix of factors such as drought and degraded land, political instability, conflicts, ethnic tensions and a large, inefficient state-led economy. However, the economy has seen one of the continent’s best economic growth trajectories in recent years thanks to deep structural reforms, IMF support and an infrastructure push, and this strong economic performance should continue in 2026.
19th poorest country: Mali
GDP per capita 2026 Consensus Forecast: USD 1137
Mali is highly reliant on agriculture, particularly cotton and livestock, making it vulnerable to climate change, droughts, and desertification. Additionally, corruption and shoddy infrastructure have discouraged foreign investment, keeping Mali trapped in poverty despite its sizable natural resources—particularly gold. Poverty is exacerbated by ongoing conflict in the northern regions against Islamist insurgencies and rebel groups, as well as by recurring political instability; successful coups took place in 2020 and 2021 for instance. The security situation has worsened in recent years due to the withdrawal of both French and UN peacekeeping troops.
20th poorest country: Guinea-Bissau
GDP per capita 2026 Consensus Forecast: USD 1171
Guinea-Bissau struggles with political instability: Frequent coups and a lack of effective governance have prevented the development of institutions and infrastructure. Drug trafficking is another major issue; Guinea-Bissau serves as a transit hub for cocaine smuggling, further eroding government stability. Moreover, the economy is largely dependent on nut exports, making it vulnerable to global market fluctuations and extreme weather. In addition, limited access to education, healthcare, and clean water keeps much of the population in poverty. That said, the economy should grow above the SSA average over our forecast horizon, thanks to IMF financial support and healthy infrastructure investment.
PART II
The World’s Poorest Countries: Understanding Global Economic Inequality In 2026
When we talk about the poorest country in the world, we’re looking at nations where millions struggle to survive on less than a few dollars per day. Understanding global poverty isn’t just about statistics – it’s about recognizing the human cost of economic inequality that affects 808 million people worldwide as of 2026. Most of these individuals are concentrated in Sub-Saharan Africa, where conflict, climate change, and weak institutions create devastating cycles of poverty. To accurately compare poverty levels across countries, economists use GDP per capita adjusted for purchasing power parity (PPP), which accounts for local price differences. By this measure, South Sudan ranks as the poorest nation globally, with a GDP per capita of just $716. This stark reality highlights why understanding global poverty matters for anyone interested in international economics, humanitarian issues, or simply grasping how interconnected our world truly is.
![]()
Key Takeaways
- South Sudan ranks as the world’s poorest country with a GDP per capita of just $313, where 80% live below the poverty line and devastating civil wars have destroyed economic infrastructure.
- Yemen and Afghanistan follow closely behind, both devastated by prolonged conflicts that have collapsed their economies and created massive humanitarian crises affecting millions.
- Sub-Saharan Africa dominates the list of poorest nations, with countries like Burundi, Central African Republic, Madagascar, and Malawi trapped in cycles of poverty due to conflict, climate disasters, and weak governance.
- A global humanitarian funding crisis has emerged in 2026, with a $25 billion gap leaving aid organizations unable to respond to critical needs as 808 million people worldwide live in extreme poverty.
- These nations share common challenges including armed conflict, climate vulnerability, resource curses, political instability, and geographic disadvantages that create persistent poverty traps spanning generations.
1. South Sudan – GDP Per Capita: $313
South Sudan holds the unfortunate distinction of being the poorest country in the world, with a per capita income that barely covers basic survival needs.
Despite gaining independence in 2011 with hopes for a brighter future, the nation has been devastated by brutal civil wars that have torn apart its social and economic fabric.
A staggering 80% of the population lives below the poverty line, while 92% are classified as multidimensionally poor ( lacking access to education, healthcare, and basic services).
Inflation reached a crushing 128% in 2024, making even essential goods unaffordable for most families. The country suffers from what economists call the “resource curse,” where oil wealth (accounting for 90% of government revenue) has fueled conflict rather than prosperity.
Constant warfare disrupts oil exports and destroys traditional agricultural systems that families depend on for survival.
Climate events like floods and droughts compound these challenges, leaving millions facing acute hunger and displacement.
2. Yemen – GDP Per Capita: $415
Yemen’s devastating position as the second-poorest country reflects the catastrophic impact of nearly a decade of civil war that has transformed what was already one of the Arab world’s most impoverished nations into a humanitarian disaster zone.
The ongoing conflict between the Saudi-backed government and Houthi rebels has claimed over 150,000 lives while systematically destroying the country’s economic infrastructure and pushing 80% of the population below the poverty line.
Oil exports, which once served as Yemen’s primary economic lifeline, have virtually collapsed due to damaged infrastructure and continued hostilities, while government revenues have plummeted by more than 70% since the war began.
The humanitarian crisis has reached unprecedented levels, with over 21 million people – nearly two-thirds of the population – requiring humanitarian assistance and protection services to survive.
Yemen’s healthcare system has largely disintegrated, leaving millions vulnerable to preventable diseases, while contaminated water sources have triggered repeated cholera outbreaks that have infected over one million people.
Food insecurity affects more than half the population, with acute malnutrition rates among children reaching emergency thresholds in many regions, creating a lost generation whose development has been permanently stunted by conflict and deprivation.
3. Afghanistan – GDP Per Capita: $417
Afghanistan’s position as the third-poorest country reflects the catastrophic economic collapse that followed the Taliban’s return to power in August 2021, which triggered an immediate freeze of international aid and foreign assets worth $9.5 billion.
The economy has contracted by an estimated 30% since the Taliban takeover, while unemployment has soared to over 40%, leaving millions of families without any source of income in a country where 95% of the population lacks sufficient food.
Women and girls bear a disproportionate burden of this crisis, as Taliban restrictions have banned them from most jobs and education, effectively removing half the workforce from an already devastated economy.
The humanitarian situation has reached desperate levels, with 28.8 million people, nearly 70% of the population, requiring humanitarian assistance to survive, making Afghanistan home to the world’s largest humanitarian crisis.
Banking system restrictions have paralyzed commerce and prevented even basic transactions, while the collapse of development projects has eliminated hundreds of thousands of jobs that families depended on.
Drought and climate disasters compound these man-made crises, destroying crops and livestock that provide the last lifeline for rural communities already pushed to the brink of survival.
Tired of hidden banking fees and low service?
Switch to a bank account that works as hard as you do with better benefits and lower costs.
4. Burundi – GDP Per Capita: $486
Burundi’s position as the fourth-poorest country globally reflects the devastating impact of decades-long civil conflicts that have systematically destroyed economic infrastructure and displaced millions of people from productive activities.
Despite being roughly the size of Maryland, this landlocked East African nation struggles to support 13.7 million people on limited arable land, creating intense competition for resources and contributing to recurring cycles of violence.
The economy remains overwhelmingly dependent on subsistence agriculture, which employs 80% of the population but generates barely enough income to survive, with most families living on less than $1.90 per day.
Political instability has scared away foreign investors and international aid organizations, while government corruption has diverted scarce resources away from essential services like healthcare, education, and infrastructure development.
Burundi suffers from one of the world’s highest population densities relative to arable land, meaning each family typically farms less than one acre, insufficient to provide adequate nutrition or generate surplus income.
The country’s isolation from major trade routes and lack of natural resources beyond agriculture have created a poverty trap where economic opportunities remain extremely limited for the vast majority of citizens.
5. Central African Republic – GDP Per Capita: $599
The Central African Republic (CAR) ranks as the fifth-poorest country globally, trapped in a devastating cycle of conflict and institutional collapse that has persisted for over a decade.
Since 2013, sectarian violence between Christian and Muslim militias has torn apart the social fabric, displacing over one million people and destroying what little economic infrastructure existed.
The country’s vast mineral wealth, including diamonds, gold, and uranium, has become a curse rather than a blessing, fueling armed groups and corruption while ordinary citizens see no benefit from these resources.
CAR’s government controls less than half of its own territory, with armed groups occupying diamond mines and smuggling routes that could otherwise generate desperately needed tax revenue.
The economy has contracted by more than 30% since the conflict began, while 71% of the population now lives below the poverty line, surviving on less than $1.90 per day.
International peacekeeping forces have struggled to restore stability, and the humanitarian crisis continues to worsen, with 3.4 million people requiring emergency assistance in a country of just 5.5 million inhabitants.
6. Madagascar – GDP Per Capita: $616
Madagascar’s position as the sixth-poorest country highlights how geographic isolation and political instability can trap even resource-rich nations in persistent poverty cycles.
Despite being the world’s fourth-largest island with abundant natural resources including vanilla, cobalt, and precious stones, over 75% of Madagascar’s 30 million people survive on less than $1.90 per day.
Recurring political crises and coups have scared away foreign investment and disrupted economic development, while weak governance has allowed widespread corruption to divert resources away from essential public services.
The country faces severe climate vulnerabilities, with cyclones, droughts, and floods regularly destroying crops and infrastructure, pushing rural communities deeper into food insecurity and malnutrition.
Madagascar’s economy remains heavily dependent on agriculture, which employs 80% of the workforce but generates minimal income due to outdated farming techniques and limited access to markets.
The island’s unique biodiversity, while globally significant, has been threatened by deforestation driven by poverty, as families clear forests for farmland and charcoal production to survive.
7. Malawi – GDP Per Capita: $622
Malawi’s position as the seventh-poorest country demonstrates how geographic disadvantages and climate vulnerability can trap landlocked nations in persistent poverty despite relative political stability.
This small southeastern African nation depends almost entirely on rain-fed agriculture, which employs 80% of the population but generates barely enough income to survive, with most families earning less than $2 per day from small-scale farming.
Recurring droughts and floods have devastated crop yields in recent years, pushing food insecurity to crisis levels and forcing 4.8 million people to require humanitarian assistance in a country of just 20 million inhabitants.
Malawi’s economy relies heavily on tobacco exports, which account for over 50% of foreign exchange earnings, but global health campaigns and declining demand have severely reduced prices and government revenues.
The country faces a severe foreign currency shortage that has made it difficult to import essential goods like fuel and fertilizer, while high population density has led to overfarming and soil degradation that reduces agricultural productivity.
Despite these challenges, Malawi has maintained democratic governance and avoided the armed conflicts that plague many neighboring countries, providing a foundation for potential economic recovery if climate adaptation and agricultural modernization can be achieved.
8. North Korea – GDP Per Capita: $640
North Korea’s position among the world’s poorest countries reflects the devastating economic impact of decades-long international sanctions and a rigid command economy that prioritizes military spending over basic human needs.
The hermit kingdom’s GDP per capita of just $640 masks extreme inequality, where the ruling elite in Pyongyang live in relative luxury while rural populations face chronic malnutrition and lack access to basic services like electricity and clean water.
International sanctions imposed due to nuclear weapons development have severely restricted trade and foreign investment, while the government’s “Juche” ideology of self-reliance has isolated the economy from global markets and technological advancement.
An estimated 40% of North Korea’s 26 million people are undernourished, with the UN reporting that stunting affects one in five children under five years old due to persistent food shortages and limited agricultural productivity.
The country’s economy remains heavily dependent on coal mining and textile manufacturing, but sanctions have blocked most export opportunities, forcing many citizens to rely on black market activities and informal trade with China to survive.
Despite possessing significant mineral resources including coal, iron ore, and rare earth elements, North Korea’s economic potential remains locked away by political isolation and a system that diverts an estimated 25% of GDP to military expenditures.
9. Eritrea – GDP Per Capita: $656
Eritrea’s position as the ninth-poorest country reflects the devastating impact of authoritarian rule and international isolation that has transformed what could have been a prosperous Red Sea nation into one of Africa’s most repressive and economically stagnant states.
The country operates under one of the world’s most brutal dictatorships, where indefinite military conscription forces citizens into unpaid labor for decades, effectively creating a system of modern slavery that has driven hundreds of thousands to flee their homeland.
Eritrea’s economy remains largely cut off from international markets due to UN sanctions and the government’s hostile relationships with neighboring countries, while domestic businesses struggle under heavy state control and arbitrary regulations that stifle entrepreneurship.
The nation’s strategic location along the Red Sea shipping lanes and significant mineral deposits including gold, copper, and potash represent untapped economic potential that remains locked away by political repression and international isolation.
Humanitarian organizations have virtually no access to assess conditions inside Eritrea, but refugees report widespread food shortages, lack of basic services, and economic desperation that forces families to risk dangerous journeys across deserts and seas to escape.
Despite achieving independence in 1993 after a 30-year liberation struggle, Eritrea has become a cautionary tale of how authoritarian governance can trap even resource-rich nations in poverty and international isolation.
10. Mozambique – GDP Per Capita: $690
Mozambique’s position as the tenth-poorest country demonstrates how natural disasters and insurgent violence can devastate even nations with significant natural resource potential, including vast offshore natural gas reserves worth billions of dollars.
The country has been battered by recurring cyclones and floods that regularly destroy infrastructure and agricultural production, while an Islamic insurgency in the northern Cabo Delgado province has displaced over 800,000 people and halted lucrative gas extraction projects.
Despite possessing some of the world’s largest untapped natural gas reserves, Mozambique remains trapped in poverty with 65% of its 33 million people living below the poverty line and lacking access to basic services like electricity and clean water.
The economy depends heavily on agriculture, which employs 70% of the workforce but remains vulnerable to climate shocks, while corruption and weak governance have prevented resource wealth from benefiting ordinary citizens.
Major international energy companies have invested over $60 billion in gas projects, but security concerns and infrastructure challenges have delayed production, leaving communities without the promised economic benefits.
The humanitarian crisis continues to worsen, with 4.3 million people requiring emergency assistance, while the combination of conflict, climate disasters, and economic instability threatens to push even more families into extreme poverty.
The Humanitarian Crisis: Food Insecurity And Aid Funding Collapse
The world’s poorest countries face an unprecedented humanitarian crisis in 2026, with Sudan alone having more people in famine conditions than anywhere else on Earth and requiring $4.2 billion in emergency aid.
This crisis has been severely worsened by dramatic cuts to foreign assistance budgets from traditional donor countries, including the United States, United Kingdom, Canada, and other wealthy nations that have historically provided crucial humanitarian support.
The USAID shutdown has particularly devastating consequences, affecting healthcare access for 95 million people and education for 23 million children across the globe’s most vulnerable regions.
International humanitarian organizations report a staggering $25 billion funding gap that emerged in 2024 and has doubled in 2025, leaving aid workers unable to respond to critical needs.
The impact is visible in stark statistics: 80% of communal kitchens in Sudan have been forced to close, leaving families without their last source of nutrition.
This funding collapse comes precisely when climate disasters, conflicts, and economic shocks have pushed more people into extreme poverty than at any time in recent history.
The combination of increased need and decreased resources has created a perfect storm that threatens to reverse decades of progress in global poverty reduction.
Top 10 countries (highest poverty rates)
The leaders in this ranking have poverty headcount rates above 65.0% under the international poverty line. Note the “Latest year” column: the newest available survey year differs by country.
| Rank | Country | Region | Poverty rate (%) | Latest year |
|---|---|---|---|---|
| 1 | Congo, Dem. Rep. | Sub-Saharan Africa | 85.3 | 2020 |
| 2 | Mozambique | Sub-Saharan Africa | 81.4 | 2022 |
| 3 | South Sudan | Sub-Saharan Africa | 76.5 | 2016 |
| 4 | Malawi | Sub-Saharan Africa | 75.4 | 2019 |
| 5 | Burundi | Sub-Saharan Africa | 74.2 | 2013 |
| 6 | Madagascar | Sub-Saharan Africa | 74.1 | 2022 |
| 7 | Niger | Sub-Saharan Africa | 72.2 | 2014 |
| 8 | Central African Republic | Sub-Saharan Africa | 70.1 | 2021 |
| 9 | Rwanda | Sub-Saharan Africa | 67.4 | 2016 |
| 10 | Lesotho | Sub-Saharan Africa | 65.0 | 2017 |
PART III
Full Top 100 table
Sorted by highest poverty headcount rate first. “Latest year” reflects the newest non-empty survey year available for the chosen indicator.
| Rank | Country | Region | Poverty rate (%) | Latest year |
|---|---|---|---|---|
| 1 | Congo, Dem. Rep. | Sub-Saharan Africa | 85.3 | 2020 |
| 2 | Mozambique | Sub-Saharan Africa | 81.4 | 2022 |
| 3 | South Sudan | Sub-Saharan Africa | 76.5 | 2016 |
| 4 | Malawi | Sub-Saharan Africa | 75.4 | 2019 |
| 5 | Burundi | Sub-Saharan Africa | 74.2 | 2013 |
| 6 | Madagascar | Sub-Saharan Africa | 74.1 | 2022 |
| 7 | Niger | Sub-Saharan Africa | 72.2 | 2014 |
| 8 | Central African Republic | Sub-Saharan Africa | 70.1 | 2021 |
| 9 | Rwanda | Sub-Saharan Africa | 67.4 | 2016 |
| 10 | Lesotho | Sub-Saharan Africa | 65.0 | 2017 |
| 11 | Zambia | Sub-Saharan Africa | 64.9 | 2022 |
| 12 | Liberia | Sub-Saharan Africa | 64.1 | 2016 |
| 13 | Sierra Leone | Sub-Saharan Africa | 62.7 | 2018 |
| 14 | Guinea | Sub-Saharan Africa | 62.4 | 2018 |
| 15 | Mali | Sub-Saharan Africa | 62.3 | 2018 |
| 16 | Guinea-Bissau | Sub-Saharan Africa | 61.3 | 2018 |
| 17 | Gambia, The | Sub-Saharan Africa | 61.2 | 2020 |
| 18 | Uganda | Sub-Saharan Africa | 60.6 | 2019 |
| 19 | Togo | Sub-Saharan Africa | 59.6 | 2018 |
| 20 | Benin | Sub-Saharan Africa | 58.9 | 2021 |
| 21 | Guatemala | Latin America & Caribbean | 57.2 | 2014 |
| 22 | Nigeria | Sub-Saharan Africa | 57.0 | 2018 |
| 23 | Haiti | Latin America & Caribbean | 56.6 | 2012 |
| 24 | Tanzania | Sub-Saharan Africa | 56.2 | 2018 |
| 25 | Angola | Sub-Saharan Africa | 55.4 | 2018 |
| 26 | Ethiopia | Sub-Saharan Africa | 55.2 | 2015 |
| 27 | Chad | Sub-Saharan Africa | 55.0 | 2022 |
| 28 | Zimbabwe | Sub-Saharan Africa | 54.8 | 2019 |
| 29 | Congo, Rep. | Sub-Saharan Africa | 54.6 | 2011 |
| 30 | Somalia | Sub-Saharan Africa | 54.0 | 2017 |
| 31 | Tajikistan | Europe & Central Asia | 53.5 | 2022 |
| 32 | Eswatini | Sub-Saharan Africa | 53.3 | 2016 |
| 33 | Yemen, Rep. | Middle East, North Africa, Afghanistan & Pakistan | 53.1 | 2014 |
| 34 | Papua New Guinea | East Asia & Pacific | 52.7 | 2016 |
| 35 | Burkina Faso | Sub-Saharan Africa | 51.9 | 2018 |
| 36 | Cameroon | Sub-Saharan Africa | 51.7 | 2014 |
| 37 | Laos | East Asia & Pacific | 51.2 | 2018 |
| 38 | Afghanistan | Middle East, North Africa, Afghanistan & Pakistan | 50.6 | 2016 |
| 39 | South Africa | Sub-Saharan Africa | 50.2 | 2022 |
| 40 | Cambodia | East Asia & Pacific | 49.6 | 2021 |
| 41 | Cote d’Ivoire | Sub-Saharan Africa | 49.4 | 2018 |
| 42 | Honduras | Latin America & Caribbean | 49.2 | 2023 |
| 43 | Myanmar | East Asia & Pacific | 49.1 | 2017 |
| 44 | Eritrea | Sub-Saharan Africa | 48.9 | 1992 |
| 45 | Zambia | Sub-Saharan Africa | 48.8 | 2015 |
| 46 | Nicaragua | Latin America & Caribbean | 47.7 | 2014 |
| 47 | Kenya | Sub-Saharan Africa | 47.6 | 2022 |
| 48 | Nepal | South Asia | 47.4 | 2022 |
| 49 | El Salvador | Latin America & Caribbean | 46.8 | 2019 |
| 50 | Mauritania | Sub-Saharan Africa | 46.6 | 2014 |
| 51 | Georgia | Europe & Central Asia | 46.2 | 2023 |
| 52 | Philippines | East Asia & Pacific | 46.1 | 2021 |
| 53 | Bangladesh | South Asia | 45.4 | 2022 |
| 54 | Ghana | Sub-Saharan Africa | 45.2 | 2016 |
| 55 | Namibia | Sub-Saharan Africa | 44.8 | 2015 |
| 56 | Pakistan | Middle East, North Africa, Afghanistan & Pakistan | 44.7 | 2018 |
| 57 | Bolivia | Latin America & Caribbean | 44.3 | 2022 |
| 58 | Senegal | Sub-Saharan Africa | 44.2 | 2018 |
| 59 | Sudan | Sub-Saharan Africa | 43.9 | 2014 |
| 60 | Cabo Verde | Sub-Saharan Africa | 43.7 | 2015 |
| 61 | India | South Asia | 43.5 | 2022 |
| 62 | Kiribati | East Asia & Pacific | 43.3 | 2006 |
| 63 | Djibouti | Middle East, North Africa, Afghanistan & Pakistan | 42.9 | 2017 |
| 64 | Micronesia, Fed. Sts. | East Asia & Pacific | 42.8 | 2013 |
| 65 | Albania | Europe & Central Asia | 42.7 | 2022 |
| 66 | Armenia | Europe & Central Asia | 42.5 | 2022 |
| 67 | Kosovo | Europe & Central Asia | 42.3 | 2021 |
| 68 | Tonga | East Asia & Pacific | 42.2 | 2015 |
| 69 | Equatorial Guinea | Sub-Saharan Africa | 41.7 | 2006 |
| 70 | Moldova | Europe & Central Asia | 41.6 | 2022 |
| 71 | Timor-Leste | East Asia & Pacific | 41.4 | 2014 |
| 72 | Fiji | East Asia & Pacific | 41.3 | 2019 |
| 73 | Comoros | Sub-Saharan Africa | 41.1 | 2013 |
| 74 | Dominican Republic | Latin America & Caribbean | 40.9 | 2022 |
| 75 | Samoa | East Asia & Pacific | 40.4 | 2013 |
| 76 | Botswana | Sub-Saharan Africa | 39.9 | 2015 |
| 77 | Sao Tome and Principe | Sub-Saharan Africa | 39.8 | 2017 |
| 78 | Mongolia | East Asia & Pacific | 39.7 | 2018 |
| 79 | Indonesia | East Asia & Pacific | 39.5 | 2023 |
| 80 | Gabon | Sub-Saharan Africa | 39.2 | 2017 |
| 81 | Nauru | East Asia & Pacific | 39.1 | 2012 |
| 82 | Vanuatu | East Asia & Pacific | 39.0 | 2019 |
| 83 | Egypt, Arab Rep. | Middle East, North Africa, Afghanistan & Pakistan | 38.7 | 2018 |
| 84 | Morocco | Middle East, North Africa, Afghanistan & Pakistan | 38.3 | 2019 |
| 85 | Ukraine | Europe & Central Asia | 38.0 | 2021 |
| 86 | Tunisia | Middle East, North Africa, Afghanistan & Pakistan | 37.8 | 2021 |
| 87 | Sri Lanka | South Asia | 37.4 | 2022 |
| 88 | Iran, Islamic Rep. | Middle East, North Africa, Afghanistan & Pakistan | 37.2 | 2019 |
| 89 | Peru | Latin America & Caribbean | 36.8 | 2023 |
| 90 | Kyrgyz Republic | Europe & Central Asia | 36.4 | 2023 |
| 91 | North Macedonia | Europe & Central Asia | 36.3 | 2021 |
| 92 | Jordan | Middle East, North Africa, Afghanistan & Pakistan | 36.0 | 2017 |
| 93 | Argentina | Latin America & Caribbean | 35.9 | 2023 |
| 94 | Bhutan | South Asia | 35.3 | 2022 |
| 95 | Colombia | Latin America & Caribbean | 35.2 | 2023 |
| 96 | Azerbaijan | Europe & Central Asia | 34.8 | 2023 |
| 97 | Iraq | Middle East, North Africa, Afghanistan & Pakistan | 34.4 | 2012 |
| 98 | Algeria | Middle East, North Africa, Afghanistan & Pakistan | 34.0 | 2011 |
| 99 | Turkey | Europe & Central Asia | 33.9 | 2022 |
| 100 | Paraguay | Latin America & Caribbean | 33.8 | 2023 |
UEFA Country Ranking 2026
Last update: Wed, 11 Mar 2026 22:55:06 CET
This page shows the calculation of the UEFA country ranking of 2026, which is determined by the sum of the UEFA country coefficients over the last 5 years. The column ‘teams’ lists the number of participating clubs in the last year for that association. In the current season also the number of clubs still in competition is listed (and indicated by a blue color). For all details see Calculation of coefficients.
| # | country | 21/22 | 22/23 | 23/24 | 24/25 | 25/26 | ranking | teams | |
|---|---|---|---|---|---|---|---|---|---|
| 1 |
|
England | 21.000 | 23.000 | 17.375 | 29.464 | 22.513 | 113.352 | 9/ 9 |
| 2 |
|
Italy | 15.714 | 22.357 | 21.000 | 21.875 | 17.357 | 98.303 | 4/ 7 |
| 3 |
|
Spain | 18.428 | 16.571 | 16.062 | 23.892 | 18.031 | 92.984 | 6/ 8 |
| 4 |
|
Germany | 16.214 | 17.125 | 19.357 | 18.421 | 18.000 | 89.117 | 5/ 7 |
| 5 |
|
France | 18.416 | 12.583 | 16.250 | 17.928 | 15.250 | 80.427 | 4/ 7 |
| 6 |
|
Portugal | 12.916 | 12.500 | 11.000 | 16.250 | 16.600 | 69.266 | 3/ 5 |
| 7 |
|
Netherlands | 19.200 | 13.500 | 10.000 | 15.250 | 9.062 | 67.012 | 1/ 6 |
| 8 |
|
Belgium | 6.600 | 14.200 | 14.400 | 15.650 | 11.000 | 61.850 | 1/ 5 |
| 9 |
|
Türkiye | 6.700 | 11.800 | 12.000 | 10.300 | 10.675 | 51.475 | 2/ 5 |
| 10 |
|
Czechia | 6.700 | 6.750 | 13.500 | 10.550 | 10.825 | 48.325 | 2/ 5 |
| 11 |
|
Greece | 8.000 | 2.125 | 11.400 | 12.687 | 12.900 | 47.112 | 2/ 5 |
| 12 |
|
Poland | 4.625 | 7.750 | 6.875 | 11.750 | 15.250 | 46.250 | 2/ 4 |
| 13 |
|
Denmark | 7.800 | 5.900 | 8.500 | 7.656 | 11.750 | 41.606 | 1/ 4 |
| 14 |
|
Norway | 7.625 | 5.750 | 8.000 | 11.812 | 8.050 | 41.237 | 1/ 5 |
| 15 |
|
Cyprus | 4.125 | 5.100 | 3.750 | 10.562 | 11.906 | 35.443 | 1/ 4 |
| 16 |
|
Switzerland | 7.750 | 8.500 | 5.200 | 7.050 | 6.200 | 34.700 | 5 |
| 17 |
|
Austria | 10.400 | 4.900 | 4.800 | 9.650 | 4.100 | 33.850 | 5 |
| 18 |
|
Scotland | 7.900 | 3.500 | 6.400 | 9.250 | 5.000 | 32.050 | 5 |
| 19 |
|
Sweden | 5.125 | 6.250 | 1.875 | 11.375 | 5.000 | 29.625 | 4 |
| 20 |
|
Croatia | 6.000 | 3.375 | 5.875 | 5.875 | 6.781 | 27.906 | 1/ 4 |
| 21 |
|
Israel | 6.750 | 6.250 | 8.750 | 2.875 | 2.875 | 27.500 | 4 |
| 22 |
|
Hungary | 2.750 | 5.875 | 4.500 | 6.625 | 6.937 | 26.687 | 1/ 4 |
| 23 |
|
Serbia | 9.500 | 5.375 | 1.400 | 3.725 | 5.750 | 25.750 | 4 |
| 24 |
|
Romania | 2.250 | 6.250 | 3.250 | 7.750 | 5.750 | 25.250 | 4 |
| 25 |
|
Ukraine | 4.200 | 5.700 | 4.100 | 3.600 | 6.812 | 24.412 | 1/ 4 |
| 26 |
|
Slovenia | 3.000 | 2.125 | 3.875 | 9.093 | 5.875 | 23.968 | 1/ 4 |
| 27 |
|
Azerbaijan | 4.375 | 4.000 | 5.875 | 2.875 | 5.812 | 22.937 | 4 |
| 28 |
|
Russia | 5.300 | 4.333 | 4.333 | 4.333 | 4.333 | 22.632 | 0 |
| 29 |
|
Slovakia | 4.125 | 6.000 | 5.000 | 4.625 | 2.625 | 22.375 | 4 |
| 30 |
|
Bulgaria | 3.375 | 4.500 | 4.375 | 3.625 | 5.187 | 21.062 | 4 |
| 31 |
|
Ireland | 2.875 | 3.375 | 1.500 | 5.343 | 4.250 | 17.343 | 4 |
| 32 |
|
Iceland | 1.500 | 3.000 | 3.833 | 4.562 | 3.625 | 16.520 | 4 |
| 33 |
|
Armenia | 1.875 | 2.375 | 2.250 | 4.375 | 4.187 | 15.062 | 4 |
| 34 |
|
Moldova | 5.250 | 3.750 | 2.000 | 2.125 | 1.500 | 14.625 | 4 |
| 35 |
|
Finland | 3.750 | 2.625 | 1.750 | 2.250 | 3.625 | 14.000 | 4 |
| 36 |
|
Kosovo | 2.333 | 2.875 | 3.000 | 2.000 | 3.781 | 13.989 | 4 |
| 37 |
|
Kazakhstan | 2.875 | 1.125 | 3.125 | 3.000 | 3.625 | 13.750 | 4 |
| 38 |
|
Bosnia-Herzegovina | 1.625 | 2.000 | 2.250 | 4.531 | 3.312 | 13.718 | 4 |
| 39 |
|
Latvia | 2.625 | 2.750 | 1.625 | 3.875 | 2.000 | 12.875 | 4 |
| 40 |
|
Faroe Islands | 1.500 | 2.250 | 2.750 | 1.500 | 1.750 | 9.750 | 4 |
| 41 |
|
Malta | 1.875 | 2.625 | 1.500 | 1.000 | 2.000 | 9.000 | 4 |
| 42 |
|
Liechtenstein | 0.000 | 6.500 | 0.500 | 0.500 | 1.000 | 8.500 | 1 |
| 43 |
|
Estonia | 3.666 | 1.166 | 0.125 | 1.625 | 1.625 | 8.207 | 4 |
| 44 |
|
Albania | 1.625 | 0.875 | 2.125 | 1.250 | 2.250 | 8.125 | 4 |
| 45 |
|
North Macedonia | 0.625 | 1.625 | 1.500 | 0.666 | 3.343 | 7.759 | 4 |
| 46 |
|
Lithuania | 1.750 | 2.375 | 1.125 | 1.375 | 1.125 | 7.750 | 4 |
| 47 |
|
Northern Ireland | 1.625 | 1.250 | 1.125 | 1.500 | 1.750 | 7.250 | 4 |
| 48 |
|
Gibraltar | 1.250 | 0.875 | 0.166 | 1.500 | 3.333 | 7.124 | 3 |
| 49 |
|
Andorra | 1.500 | 0.666 | 1.666 | 1.000 | 2.000 | 6.832 | 3 |
| 50 |
|
Belarus | 0.250 | 0.625 | 1.750 | 1.875 | 2.125 | 6.625 | 4 |
| 51 |
|
Luxembourg | 1.250 | 1.125 | 2.250 | 1.250 | 0.750 | 6.625 | 4 |
| 52 |
|
Montenegro | 0.750 | 1.000 | 1.333 | 2.500 | 1.000 | 6.583 | 3 |
| 53 |
|
Georgia | 1.250 | 1.125 | 1.250 | 1.250 | 1.125 | 6.000 | 4 |
| 54 |
|
Wales | 1.500 | 1.166 | 0.625 | 2.000 | 0.333 | 5.624 | 3 |
| 55 |
|
San Marino | 0.166 | 0.833 | 0.333 | 0.666 | 0.833 | 2.831 | 3 |
|
|
Finland | 7.74 | 1st |
|
|
Denmark | 7.52 | 2nd |
|
|
Iceland | 7.52 | 3rd |
|
|
Sweden | 7.35 | 4th |
|
|
Netherlands | 7.31 | 5th |
|
|
Costa Rica | 7.27 | 6th |
|
|
Norway | 7.26 | 7th |
|
|
Israel | 7.23 | 8th |
|
|
Luxembourg | 7.12 | 9th |
|
|
Mexico | 6.98 | 10th |
|
|
Australia | 6.97 | 11th |
|
|
New Zealand | 6.95 | 12th |
|
|
Switzerland | 6.94 | 13th |
|
|
Belgium | 6.91 | 14th |
|
|
Ireland | 6.89 | 15th |
|
|
Lithuania | 6.83 | 16th |
|
|
Austria | 6.81 | 17th |
|
|
Canada | 6.80 | 18th |
|
|
Slovenia | 6.79 | 19th |
|
|
Czechia | 6.78 | 20th |
|
|
United Arab Emirates | 6.76 | 21st |
|
|
Germany | 6.75 | 22nd |
|
|
United Kingdom | 6.73 | 23rd |
|
|
United States | 6.72 | 24th |
|
|
Belize | 6.71 | 25th |
|
|
Taiwan | 6.67 | 27th |
|
|
Kuwait | 6.63 | 30th |
|
|
Serbia | 6.61 | 31st |
|
|
Saudi Arabia | 6.60 | 32nd |
|
|
France | 6.59 | 33rd |
|
|
Singapore | 6.57 | 34th |
|
|
Romania | 6.56 | 35th |
|
|
Brazil | 6.49 | 36th |
|
|
El Salvador | 6.49 | 37th |
|
|
Spain | 6.47 | 38th |
|
|
Italy | 6.42 | 40th |
|
|
Estonia | 6.42 | 39th |
|
|
Panama | 6.41 | 41st |
|
|
Argentina | 6.40 | 42nd |
|
|
Kazakhstan | 6.38 | 43rd |
|
|
Poland | 6.37 | 26th |
|
|
Chile | 6.36 | 45th |
|
|
Guatemala | 6.36 | 44th |
|
|
Vietnam | 6.35 | 46th |
|
|
Nicaragua | 6.33 | 47th |
|
|
Malta | 6.32 | 48th |
|
|
Thailand | 6.22 | 49th |
|
|
Slovakia | 6.22 | 50th |
|
|
Latvia | 6.21 | 51st |
|
|
Oman | 6.20 | 52nd |
|
|
Uzbekistan | 6.19 | 53rd |
|
|
Paraguay | 6.17 | 54th |
|
|
Japan | 6.15 | 55th |
|
|
Bosnia and Herzegovina | 6.14 | 56th |
|
|
Philippines | 6.11 | 57th |
|
|
South Korea | 6.04 | 58th |
|
|
Bahrain | 6.03 | 59th |
|
|
Portugal | 6.01 | 60th |
|
|
Colombia | 6.00 | 61st |
|
|
Ecuador | 5.97 | 62nd |
|
|
Malaysia | 5.96 | 64th |
|
|
Honduras | 5.96 | 63rd |
|
|
Russia | 5.95 | 66th |
|
|
Peru | 5.95 | 65th |
|
|
Cyprus | 5.94 | 67th |
|
|
China | 5.92 | 68th |
|
|
Hungary | 5.92 | 69th |
|
|
Tunisia | 5.91 | 70th |
|
|
Montenegro | 5.88 | 71st |
|
|
Bolivia | 5.87 | 74th |
|
|
Croatia | 5.87 | 72nd |
|
|
Jamaica | 5.87 | 73rd |
|
|
Kyrgyzstan | 5.86 | 75th |
|
|
Dominican Republic | 5.85 | 76th |
|
|
Mongolia | 5.83 | 77th |
|
|
Mauritius | 5.83 | 78th |
|
|
Libya | 5.82 | 79th |
|
|
Moldova | 5.82 | 80th |
|
|
Greece | 5.78 | 81st |
|
|
Venezuela | 5.68 | 82nd |
|
|
Indonesia | 5.62 | 83rd |
|
|
Algeria | 5.57 | 84th |
|
|
Bulgaria | 5.55 | 85th |
|
|
North Macedonia | 5.50 | 86th |
|
|
Hong Kong | 5.49 | 88th |
|
|
Armenia | 5.49 | 87th |
|
|
Tajikistan | 5.41 | 90th |
|
|
Albania | 5.41 | 89th |
|
|
Georgia | 5.40 | 91st |
|
|
Nepal | 5.31 | 92nd |
|
|
Laos | 5.30 | 93rd |
|
|
Turkey | 5.26 | 94th |
|
|
South Africa | 5.21 | 95th |
|
|
Mozambique | 5.19 | 96th |
|
|
Gabon | 5.12 | 97th |
|
|
Ivory Coast | 5.10 | 98th |
|
|
Iran | 5.09 | 99th |
|
|
Republic of the Congo | 5.03 | 100th |
|
|
Iraq | 4.98 | 101st |
|
|
Guinea | 4.93 | 102nd |
|
|
Namibia | 4.91 | 103rd |
|
|
Nigeria | 4.89 | 105th |
|
|
Cameroon | 4.89 | 104th |
|
|
Azerbaijan | 4.88 | 106th |
|
|
Senegal | 4.86 | 107th |
|
|
Palestine | 4.78 | 108th |
|
|
Pakistan | 4.77 | 109th |
|
|
Niger | 4.73 | 110th |
|
|
Ukraine | 4.68 | 111th |
|
|
Morocco | 4.62 | 112th |
|
|
Mauritania | 4.54 | 114th |
|
|
Kenya | 4.51 | 115th |
|
|
Uganda | 4.46 | 116th |
|
|
Gambia | 4.42 | 117th |
|
|
India | 4.39 | 118th |
|
|
Burkina Faso | 4.38 | 120th |
|
|
Chad | 4.38 | 119th |
|
|
Benin | 4.36 | 121st |
|
|
Mali | 4.35 | 123rd |
|
|
Somalia | 4.35 | 122nd |
|
|
Ghana | 4.34 | 125th |
|
|
Cambodia | 4.34 | 124th |
|
|
Myanmar | 4.32 | 126th |
|
|
Togo | 4.32 | 127th |
|
|
Jordan | 4.31 | 128th |
|
|
Liberia | 4.28 | 129th |
|
|
Madagascar | 4.16 | 130th |
|
|
Zambia | 3.91 | 131st |
|
|
Ethiopia | 3.90 | 132nd |
|
|
Sri Lanka | 3.89 | 133rd |
|
|
Bangladesh | 3.85 | 134th |
|
|
Egypt | 3.82 | 135th |
|
|
Tanzania | 3.80 | 136th |
|
|
Eswatini | 3.77 | 137th |
|
|
Lesotho | 3.76 | 138th |
|
|
Comoros | 3.75 | 139th |
|
|
Yemen | 3.56 | 140th |
|
|
DR Congo | 3.47 | 141st |
|
|
Botswana | 3.44 | 142nd |
|
|
Zimbabwe | 3.40 | 143rd |
|
|
Malawi | 3.26 | 144th |
|
|
Lebanon | 3.19 | 145th |
|
|
Sierra Leone | 3.00 | 146th |
|
|
Afghanistan | 1.36 | 147th |
- Happiness rankings are three-year averages. For example, 2025 rankings compile data from 2022-2024, while 2024 rankings compile data from 2021-2023.
- Happiness rankings are determined by analyzing comprehensive Gallup polling data from 149 countries in six particular categories: gross domestic product per capita, social support, healthy life expectancy, freedom to make your own life choices, generosity of the general population, and perceptions of internal and external corruption levels.
- The following countries lack survey information in 2022, so their 2023 averages are based on the 2020 and 2021 survey: Zambia, Uganda, Turkey, Tajikistan, Sri Lanka, South Africa, Slovakia, Singapore, Serbia, Philippines, Pakistan, Nigeria, Myanmar, Montenegro, Malaysia, Laos, Iraq, China, Burkina Faso, Bosnia and Herzegovina, Bahrain, Algeria
- The following countries lack survey information in 2021, so their 2022 averages are based on the 2019 and 2020 survey: Yemen, Turkmenistan, Rwanda, Palestine, Niger, Mauritania, Madagascar, Luxembourg, Libya, Liberia, Lesotho, Kuwait, , Guatemala, Gambia, Eswatini, Comoros, Chad, Botswana, Belarus, Azerbaijan.
Snapshot
-
Happiness is measured using six categories including GDP per capita, social support, and healthy life expectancy, among others.
-
Northern European countries dominate the top of the happiness rankings, reflecting strong social support systems and high standards of living.
-
Finland is ranked as the happiest country in the world in 2024, with Denmark and Iceland following closely behind.
Since 2002, the World Happiness Report has used statistical analysis to determine the world’s happiest countries. In its 2024 update, the report concluded that Finland is the happiest country in the world. To determine the world’s happiest country, researchers analyzed comprehensive Gallup polling data from 143 countries for the past three years, specifically monitoring performance in six particular categories: gross domestic product per capita, social support, healthy life expectancy, freedom to make your own life choices, generosity of the general population, and perceptions of internal and external corruption levels.
In order to properly compare each country’s data, the researchers created a fictional country—christened Dystopia—filled with “the world’s least-happy people.” They then set Dystopia as the rock bottom value in each of the six categories and measured the scores of the real-world countries against this value. All six variables were then blended to create a single combined score for each country. Six out of the top seven happiest countries in the world for 2024 were Northern European countries. Finland took top honors—for the tenth year in a row—with an overall score of 7.741, followed (in order) by Denmark (7.583), Iceland (7.525), Sweden (7.344), Israel (7.341), the Netherlands (7.319), and Norway (7.302).
The Top 10 Happiest Countries in the World (World Happiness Score 2024)
The least happy country in the world for 2024 was Afghanistan, whose 143rd-place ranking of 1.721 can be attributed in part to a low life expectancy rate, low gross domestic product rates per capita, and perhaps most importantly, the recent Taliban takeover of Afghanistan. Rounding out the bottom five are Lebanon (2.707), Lesotho (3.186), Sierra Leone (3.245), and DR Congo (3.295).
The Top 7 Happiest Countries in the World for 2024
1. Finland
Finland ranks as the world’s happiest country based on the 2024 report, with a score of 7.741 out of a total possible score of 10. The citizens of Finland have strong feelings of communal support and mutual trust that not only helped secure the #1 ranking but also helped the country as a whole navigate the COVID-19 pandemic. During that trying time, Finlanders felt strongly that they were free to make their own choices and showed minimal suspicion of government corruption. Both of these factors are strong contributors to overall happiness.
2. Denmark
The second-happiest country in the world is Denmark, which scores 7.583. Denmark’s values for each of the six variables are quite comparable to those of Finland. In fact, Denmark has even outscored the leader in multiple categories, including GDP per capita and generosity. The country also scored the highest in happiness among older adults (60+).
3. Iceland
Iceland ranks as 2024’s third-happiest country in the entire world, with a total score of 7.525. Of the top seven happiest countries around the globe, Iceland boasts the highest feeling of social support. Iceland also had the second-highest generosity score in the top seven, though it’s worth noting that it ranked only 11th worldwide. Iceland is also a happier country for the youngsters at #4 than Finland (#7) and Denmark (#5).
4. Sweden
Fourth-place Sweden (7.344) ranks only #18 for happiness among the younger people (aged below 30). Yet, it is also #4 in older adults’ happiness. In fact, according to the report, along with Norway, Germany, France, the United Kingdom, and Spain, Sweden is a country where the old are now significantly happier than the young, while in Portugal, Greece, and Israel the opposite is true.
5. Israel
Fifth in the ranks of the happiest countries with a score of 7.341, Israel showed emotional resilience in the wake of the October 7th attack. Israel occupies the second spot for the happiness of the young people, just behind Lithuania. However, conversely to Sweden and Norway, the older Israelis are significantly less happy than their young fellow citizens, the country ranking #18 for senior citizens’ happiness.
6. Netherlands
Edging out Norway for the honor of sixth-happiest country in the world is the Netherlands (also known as Holland to many tulip lovers), with a score of 7.319. The Netherlands scored higher in the generosity category than any other top-seven country and also had the highest GDP.
7. Norway
The citizens of seventh-place Norway (7.302) feel they are being well cared for by their government thanks to universal healthcare and free college tuition. Norwegians also enjoy a healthy work-life balance, working an average of 27 hours per week vs. 36 hours per week in the United States. Additionally, Norway has a low crime rate and a strong sense of community among its citizens—a quality it shares with many in the top seven.
Honorable Mention: Bhutan
Bhutan was previously excluded from the 2021 report due to a technicality: each country’s scores were based upon detailed Gallup polls, but Gallup did not conduct polling in Bhutan during the required timeframe. In the 1970s, the 4th King of Bhutan stated, “Gross National Happiness is more important than Gross Domestic Product.” Since then, the idea of Gross National Happiness (GNH) has influenced Bhutan’s development policy. Its GNH Index value increased from 0.743 in 2010 to 0.781 in 2022. With a focus on mindfulness and well-being, Bhutan may soon give some of its Northern European counterparts a run for their money in terms of people’s happiness.
Sources
Other Categories
|
|
Finland | 7.74 | 1st |
|
|
Denmark | 7.52 | 2nd |
|
|
Iceland | 7.52 | 3rd |
|
|
Sweden | 7.35 | 4th |
|
|
Netherlands | 7.31 | 5th |
|
|
Costa Rica | 7.27 | 6th |
|
|
Norway | 7.26 | 7th |
|
|
Israel | 7.23 | 8th |
|
|
Luxembourg | 7.12 | 9th |
|
|
Mexico | 6.98 | 10th |
|
|
Australia | 6.97 | 11th |
|
|
New Zealand | 6.95 | 12th |
|
|
Switzerland | 6.94 | 13th |
|
|
Belgium | 6.91 | 14th |
|
|
Ireland | 6.89 | 15th |
|
|
Lithuania | 6.83 | 16th |
|
|
Austria | 6.81 | 17th |
|
|
Canada | 6.80 | 18th |
|
|
Slovenia | 6.79 | 19th |
|
|
Czechia | 6.78 | 20th |
|
|
United Arab Emirates | 6.76 | 21st |
|
|
Germany | 6.75 | 22nd |
|
|
United Kingdom | 6.73 | 23rd |
|
|
United States | 6.72 | 24th |
|
|
Belize | 6.71 | 25th |
|
|
Taiwan | 6.67 | 27th |
|
|
Kuwait | 6.63 | 30th |
|
|
Serbia | 6.61 | 31st |
|
|
Saudi Arabia | 6.60 | 32nd |
|
|
France | 6.59 | 33rd |
|
|
Singapore | 6.57 | 34th |
|
|
Romania | 6.56 | 35th |
|
|
Brazil | 6.49 | 36th |
|
|
El Salvador | 6.49 | 37th |
|
|
Spain | 6.47 | 38th |
|
|
Italy | 6.42 | 40th |
|
|
Estonia | 6.42 | 39th |
|
|
Panama | 6.41 | 41st |
|
|
Argentina | 6.40 | 42nd |
|
|
Kazakhstan | 6.38 | 43rd |
|
|
Poland | 6.37 | 26th |
|
|
Chile | 6.36 | 45th |
|
|
Guatemala | 6.36 | 44th |
|
|
Vietnam | 6.35 | 46th |
|
|
Nicaragua | 6.33 | 47th |
|
|
Malta | 6.32 | 48th |
|
|
Thailand | 6.22 | 49th |
|
|
Slovakia | 6.22 | 50th |
|
|
Latvia | 6.21 | 51st |
|
|
Oman | 6.20 | 52nd |
|
|
Uzbekistan | 6.19 | 53rd |
|
|
Paraguay | 6.17 | 54th |
|
|
Japan | 6.15 | 55th |
|
|
Bosnia and Herzegovina | 6.14 | 56th |
|
|
Philippines | 6.11 | 57th |
|
|
South Korea | 6.04 | 58th |
|
|
Bahrain | 6.03 | 59th |
|
|
Portugal | 6.01 | 60th |
|
|
Colombia | 6.00 | 61st |
|
|
Ecuador | 5.97 | 62nd |
|
|
Malaysia | 5.96 | 64th |
|
|
Honduras | 5.96 | 63rd |
|
|
Russia | 5.95 | 66th |
|
|
Peru | 5.95 | 65th |
|
|
Cyprus | 5.94 | 67th |
|
|
China | 5.92 | 68th |
|
|
Hungary | 5.92 | 69th |
|
|
Tunisia | 5.91 | 70th |
|
|
Montenegro | 5.88 | 71st |
|
|
Bolivia | 5.87 | 74th |
|
|
Croatia | 5.87 | 72nd |
|
|
Jamaica | 5.87 | 73rd |
|
|
Kyrgyzstan | 5.86 | 75th |
|
|
Dominican Republic | 5.85 | 76th |
|
|
Mongolia | 5.83 | 77th |
|
|
Mauritius | 5.83 | 78th |
|
|
Libya | 5.82 | 79th |
|
|
Moldova | 5.82 | 80th |
|
|
Greece | 5.78 | 81st |
|
|
Venezuela | 5.68 | 82nd |
|
|
Indonesia | 5.62 | 83rd |
|
|
Algeria | 5.57 | 84th |
|
|
Bulgaria | 5.55 | 85th |
|
|
North Macedonia | 5.50 | 86th |
|
|
Hong Kong | 5.49 | 88th |
|
|
Armenia | 5.49 | 87th |
|
|
Tajikistan | 5.41 | 90th |
|
|
Albania | 5.41 | 89th |
|
|
Georgia | 5.40 | 91st |
|
|
Nepal | 5.31 | 92nd |
|
|
Laos | 5.30 | 93rd |
|
|
Turkey | 5.26 | 94th |
|
|
South Africa | 5.21 | 95th |
|
|
Mozambique | 5.19 | 96th |
|
|
Gabon | 5.12 | 97th |
|
|
Ivory Coast | 5.10 | 98th |
|
|
Iran | 5.09 | 99th |
|
|
Republic of the Congo | 5.03 | 100th |
|
|
Iraq | 4.98 | 101st |
|
|
Guinea | 4.93 | 102nd |
|
|
Namibia | 4.91 | 103rd |
|
|
Nigeria | 4.89 | 105th |
|
|
Cameroon | 4.89 | 104th |
|
|
Azerbaijan | 4.88 | 106th |
|
|
Senegal | 4.86 | 107th |
|
|
Palestine | 4.78 | 108th |
|
|
Pakistan | 4.77 | 109th |
|
|
Niger | 4.73 | 110th |
|
|
Ukraine | 4.68 | 111th |
|
|
Morocco | 4.62 | 112th |
|
|
Mauritania | 4.54 | 114th |
|
|
Kenya | 4.51 | 115th |
|
|
Uganda | 4.46 | 116th |
|
|
Gambia | 4.42 | 117th |
|
|
India | 4.39 | 118th |
|
|
Burkina Faso | 4.38 | 120th |
|
|
Chad | 4.38 | 119th |
|
|
Benin | 4.36 | 121st |
|
|
Mali | 4.35 | 123rd |
|
|
Somalia | 4.35 | 122nd |
|
|
Ghana | 4.34 | 125th |
|
|
Cambodia | 4.34 | 124th |
|
|
Myanmar | 4.32 | 126th |
|
|
Togo | 4.32 | 127th |
|
|
Jordan | 4.31 | 128th |
|
|
Liberia | 4.28 | 129th |
|
|
Madagascar | 4.16 | 130th |
|
|
Zambia | 3.91 | 131st |
|
|
Ethiopia | 3.90 | 132nd |
|
|
Sri Lanka | 3.89 | 133rd |
|
|
Bangladesh | 3.85 | 134th |
|
|
Egypt | 3.82 | 135th |
|
|
Tanzania | 3.80 | 136th |
|
|
Eswatini | 3.77 | 137th |
|
|
Lesotho | 3.76 | 138th |
|
|
Comoros | 3.75 | 139th |
|
|
Yemen | 3.56 | 140th |
|
|
DR Congo | 3.47 | 141st |
|
|
Botswana | 3.44 | 142nd |
|
|

Non governmental violent actorsNGOVA – NON GOVERNMENTAL VIOLENT ACTORS NON STATE VIOLENT ACTORS FOREIGN GOVERNMENT FUNDED VIOLENT ACTORS FOGOFUVIAs FUGOFU – FOREIGN GOVERNMENT FUNDER US President Donald Trump has acknowledged that Washington tried… 
Food MixedEsiste un frutto poco conosciuto, soprattutto in occidente, ma dalle potenzialità enormi. È una sorta di palla rossa, spinosa e irsuta che cresce nelle regioni tropicali del Vietnam. Stiamo parlando… |